If you are not redirected automatically, please click on the URL below.
ページが切り替わらない場合は、https://www.english.metro.tokyo.lg.jp/w/001-101-000054をクリックしてください。

Please enable JavaScript to use the website of the Tokyo Metropolitan Government.
Main content starts here.
Population of Tokyo
Population Summary
As of October 1, 2022, the population of Tokyo is estimated to be 14.041 million, or about 11.2% of Japan's total population, and it has the largest population among all the 47 prefectures.
At 2,194 square kilometers, the area of Tokyo is 0.6% of the total area of Japan. With a population density of 6,399 persons per square kilometer, Tokyo is the most densely populated prefecture in Japan.
The ward area is home to 9.72 million persons, the Tama area, 4.297 million, and the Islands, 24,000.
Tokyo has 7.333 million households, with an average 1.91 persons per household. The number of foreign residents according to the basic resident register is 570,000 as of October 1, 2022.
Trends in Population of Tokyo
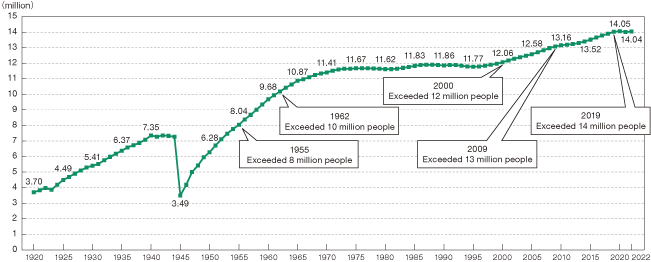
Source: Statistics Division, Bureau of General Affairs, TMG; "Tokyo Statistical Yearbook," "(Estimated) Population of Tokyo Metropolis"
Population Change
The population migration between Tokyo and other prefectures in 2022 showed 439,000 persons moving into Tokyo while 403,000 persons moved out, for a net social increase of 36,000 persons.
With the exception of 1984 and 1985, there was a prevailing trend of out-migration exceeding in-migration since 1967, until a net social increase was seen for the first time in 12 years in 1997. 2022 again showed a net increase.
Looking at the migration between Tokyo and the three adjacent prefectures (Saitama, Chiba, and Kanagawa prefectures), 200,000 people came into Tokyo while 224,000 moved out.
Looking at the natural population change, following the peak net natural increase of 182,000 in 1968, Tokyo experienced a slowing of population growth and marked its first natural decline in 2012. During 2022, there was a net natural decrease of 46,000, with about 94,000 births and 140,000 deaths.
Demographic Composition by Age
According to the Population Census, as of October 1, 2020, the population of Tokyo was 14.0476 million (Statistics Bureau, Ministry of Internal Affairs and Communications). This number was divided into three age categories: child population (ages 0 - 14) at 1.568 million; the working-age population (ages 15 - 64) at 9.284 million; and the aged population (ages 65 and over) at 3.195 million. These figures are 11.2%, 66.1% and 22.7%, respectively, of the overall population.
The percentage of aged persons exceeded the United Nations standard of 14% for an “aged society” in 1998, and Tokyo is now a “super-aged society,” with senior citizens making up 21% or more of the population.
Labor Force Population
As of October 1, 2020, the population aged 15 years and older was 12.052 million persons, of whom 7.97 million were employed and 307,000 fully unemployed within a total labor force population of 8.277 million persons.
Demographic Composition by Industry
According to the Population Census of 2020, when employed persons were viewed by the three industrial groups, 28,000 persons (0.4%) were employed in the primary industry of agriculture, forestry, and fisheries; 1.199 million (15.0%) in the secondary industry of mining, construction, and manufacturing; and 6.743 million (84.6%) in the tertiary industry of commerce, transportation, communication, and services.
Demographic Composition by Occupation
According to the Population Census of 2020, when employed persons were viewed by the four employment groups, 28,000 persons (0.4%) were employed in agriculture, forestry, and fisheries; 1.397 million (17.5%) in manufacturing and transportation-related occupations; 2.156 million (27.0%) in sales and services; and 4.39 million (55.1%) in clerical, technical, and management occupations.
Daytime Population and De Jure Population
The Population Census in 2020 lists the daytime population of Tokyo as 16.752 million people, which is 2.704 million more than the de jure population of 14.048 million. This difference is caused mainly by the daytime influx of commuting workers and students from the three neighboring prefectures of Saitama, Chiba, and Kanagawa. The daytime/nighttime population, which is daytime population per 100 de jure population, is 119.2, with the daytime population about 1.19 times more than the de jure population.
The daytime population, broken down by area, is 12.87 million in the ward area, 3.856 million in the Tama area, and 25,000 persons in the islands. The ratios of daytime per 100 de jure population for these three areas are 132.2, 89.9, and 102.5, respectively, with the ward figure noticeably higher. The three central wards—Chiyoda, Chuo and Minato— are especially high at 629.2 (a de jure population of 496,000 and a daytime population of 3.123 million), making their daytime population more than six times higher than the de jure population.
Changes in the metropolis since 1965 show that while the de jure population increased by 3.178 million (29.2%) during the period up to 2020, the daytime population had a much greater increase of 5 million (42.5%).
Changes in Population Composition by Three Age Groups
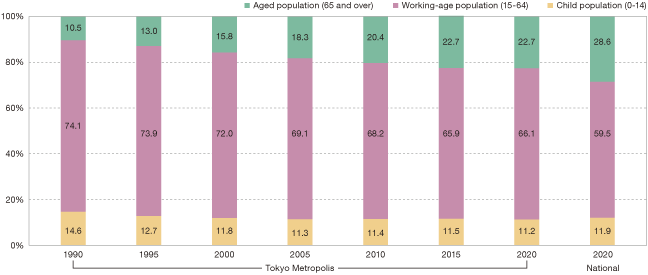
Note 1: As the denominator (total population) from 1990 to 2005 used to calculate the percentages includes persons of unknown age, totals do not reach 100%.
Note 2: Figures for 2020 are from imputed values.
Source: Statistics Bureau, Ministry of Internal Affairs and Communications; "Population Census"
Changes in Tokyo's Daytime and De Jure Populations
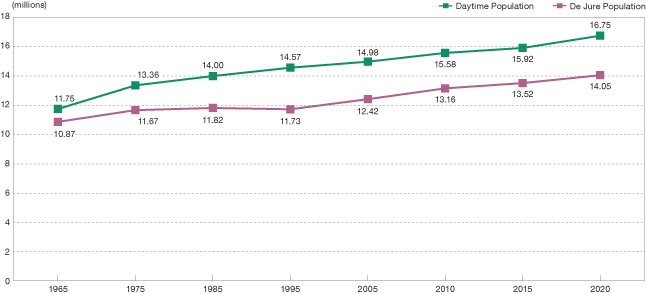
Note 1: Both daytime and nighttime populations exclude persons whose ages are unknown.
Note 2: Figures for 2020 are from imputed values.
Source: Statistics Division, Bureau of General Affairs, TMG; "Daytime Population in Tokyo"
Trends in Breakdown of Employed Persons by Three Industry Sectors
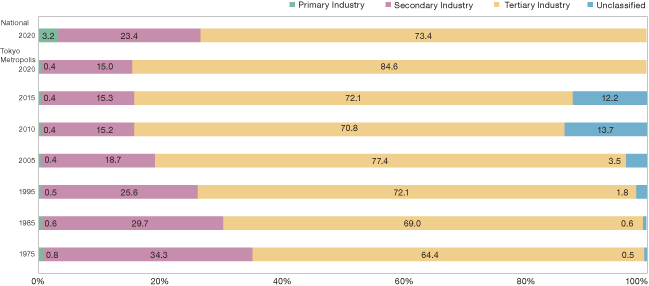
Figures for 2020 are from imputed values.
Source: Statistics Bureau, Ministry of Internal Affairs and Communications; "Population Census"
Population Commuting into Tokyo Metropolis
by Prefecture (2020)
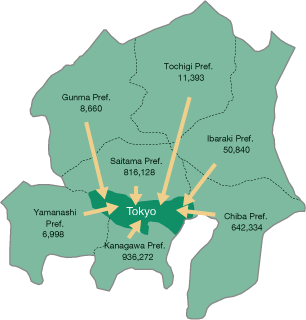
The figures indicate the number of workers who live in neighboring prefectures and commute into Tokyo.
Source: Statistics Division, Bureau of General Affairs, TMG; “Tokyo's Daytime Population”
Proportion of Workers in Tokyo Metropolis by Place of Residence (2020)
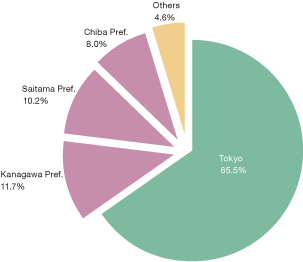
Source: Statistics Division, Bureau of General Affairs, TMG; “Tokyo's Daytime Population”